Alpha Discovery · Breakout Validation
#27 Real Breakout vs Fake Breakout: Key Signals to Check
04/10/2026 · 6 min read
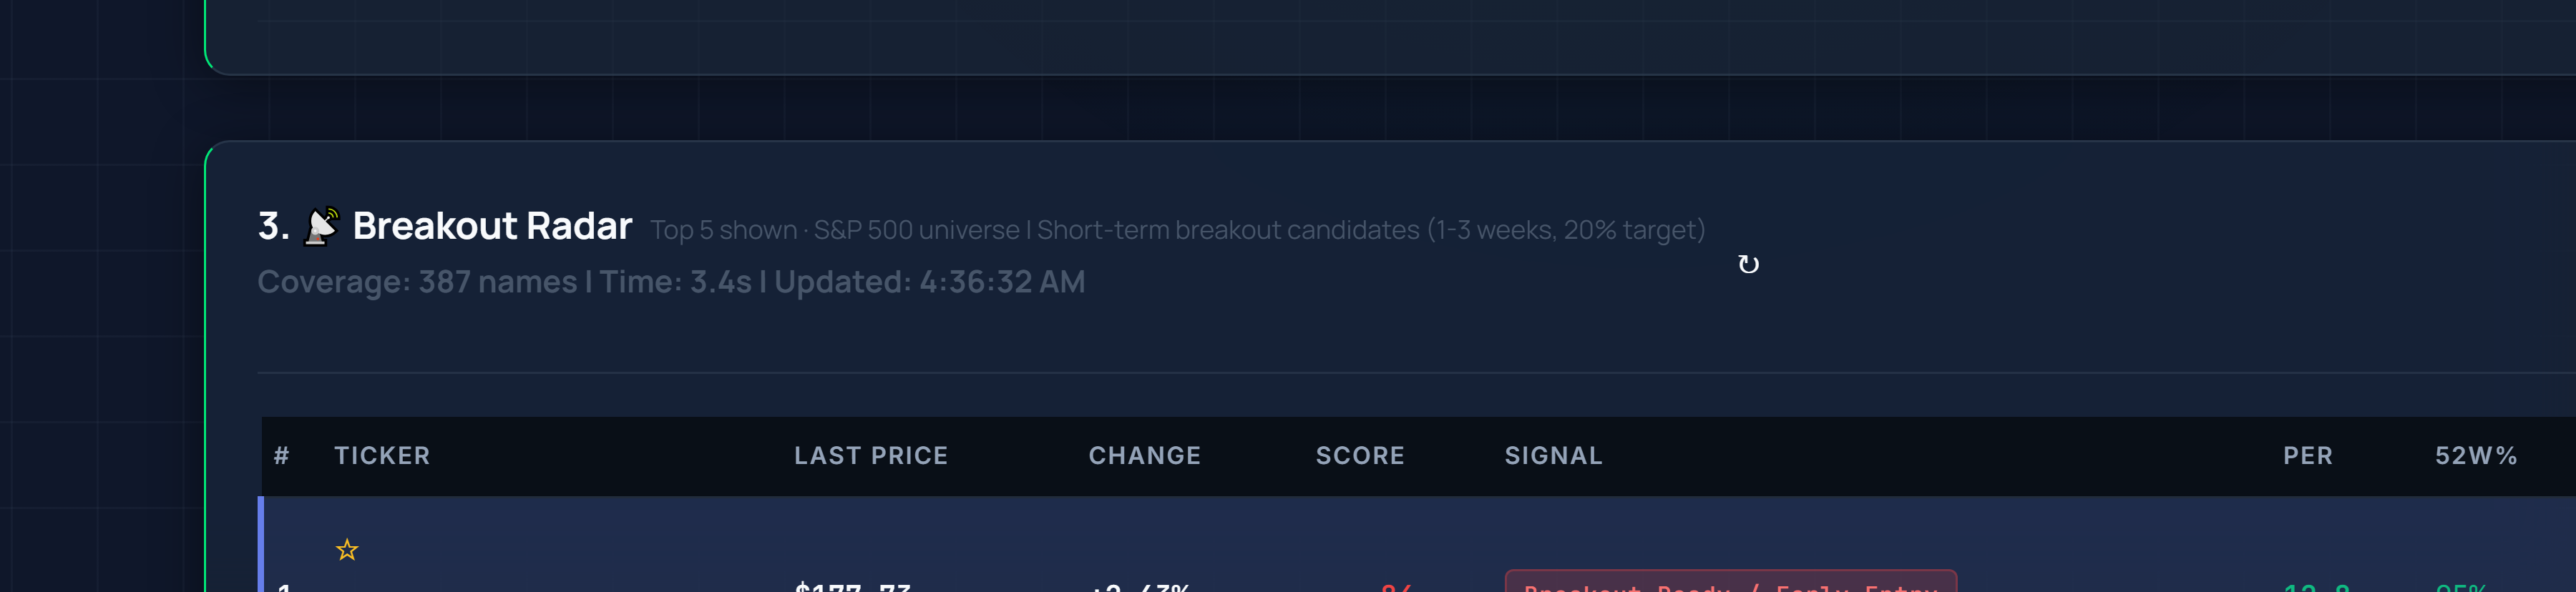
Live capture: breakout checkpoint view used for fake-vs-real validation.
📍 Home › ANALYSIS_1 › Breakout Radar
0) Where to Find This Widget
From the 12-tile dashboard, open ANALYSIS_1. Use Breakout Radar and Top 5 Breakout Picks on that page for checkpoint validation.

Live capture of Dashboard in Inveflo.
1) TL;DR
Real breakouts show persistence, participation, and context alignment. Fake breakouts usually fail one or more checkpoints. Use this checklist before every breakout entry.
Key Takeaways
- The 3-checkpoint model saves money: Signal Persistence (score ≥75 for 2+ sessions) + Volume Confirmation (VSR >1.5) + Regime Support (CMS ≥55). Real breakouts pass all 3; fakes fail at least one. This creates an objective yes/no decision that removes emotion.
- Persistence is the most critical checkpoint: A breakout that explodes on day 1 but collapses on day 2 is a fake. Wait for 2 consecutive sessions of score strength. This rule prevents FOMO entries into one-candle wonders.
- Volume is non-negotiable: VSR < 1.5 = low participation = fake breakout, regardless of how pretty the chart looks. Breakouts without real volume buying are traps. A VSR > 1.5 proves institutional interest.
- Regime veto discipline saves capital: If CMS < 55, skip the trade even if other checkpoints pass. The market structure is not supportive. Fighting a weak regime is expensive. Wait for regime improvement before entering similar setups.
2) Hook (Pain-Driven)
Most breakout traders are right on direction but wrong on timing. They enter on first movement, then get trapped in failed continuation.
3) Problem
A single breakout candle is not enough evidence. Without quality checkpoints, false breakouts consume capital and attention.
4) Solution (Widget Introduction)
Use Breakout Radar and Top 5 Breakout Picks with checkpoint rules. Confirm both score quality and behavior quality before entry.
5) Logic Breakdown (Formula + Thresholds)
- Signal Persistence: score stays ≥ 75 for 2 sessions
- Volume Confirmation: Volume Surge Ratio > 1.5
- Regime Support: Composite Market Score ≥ 55
6) Practical Use (IF X → THEN Y)
- If all 3 checkpoints pass, then execute staged entry.
- If 2 checkpoints pass, then reduce size and wait for close confirmation.
- If fewer than 2 pass, then classify as fake breakout and skip.
Should I buy now? Only when checkpoints pass. Is this signal strong? Strong means persistence plus participation. What should I do next? Apply checkpoint count, then decide size or skip.
7) Common Mistakes
- Entering before volume confirms
- Ignoring next-session persistence
- Overriding checklist due to fear of missing out
This is not a standalone buy signal and requires stop-loss and regime-aware sizing.
Frequently Asked Questions
What counts as 'signal persistence' in the RealBreakoutScore?
Signal Persistence means the breakout score stays ≥ 75 for at least 2 consecutive trading sessions. A score of 80+ on day 1 that drops to 55 on day 2 fails the persistence checkpoint. Persistence proves the market's interest is real, not a one-candle surprise.
How strict should I be about volume confirmation?
Very strict. Volume Surge Ratio must exceed 1.5 (volume is 150%+ of 20-day average). This threshold prevents fake breakouts where price jumps on low participation. If volume is weak (<1.5), classify as fake and skip, even if price looks good. Volume is the truth-teller.
What if only 2 of 3 checkpoints pass?
Reduce position size by 50% and wait for close-of-session confirmation. If 2 checkpoints pass (e.g., persistence + volume but weak regime), enter with half size and a tighter stop. This graduated approach captures winners while limiting fake-breakout losses.
Is Composite Market Score a veto or just a checkpoint?
It's a veto. If Composite Market Score < 55, the regime is not supportive. Even if Signal Persistence and Volume Confirmation pass, a weak regime makes the breakout fragile. Pass the trade and wait for regime improvement rather than fighting the market structure.
Related Blog Posts
- #4 Breakout Radar Signal Quality — Understand the signal quality scoring before applying checkpoint rules.
- #5 How to Build a Short-Swing Template with Breakout Radar — Use checkpoint validation as input to your short-swing execution template.
- #7 Breakout Radar Signal Quality Evaluation — Deepen your checkpoint evaluation with advanced signal quality assessment.
CTA: See Live Breakout Signals
CTA: Open Scanner and Find Opportunities
Scan the full S&P 500, compare quality and signal scores, and build your watch list before market open.